

How we make it effortless
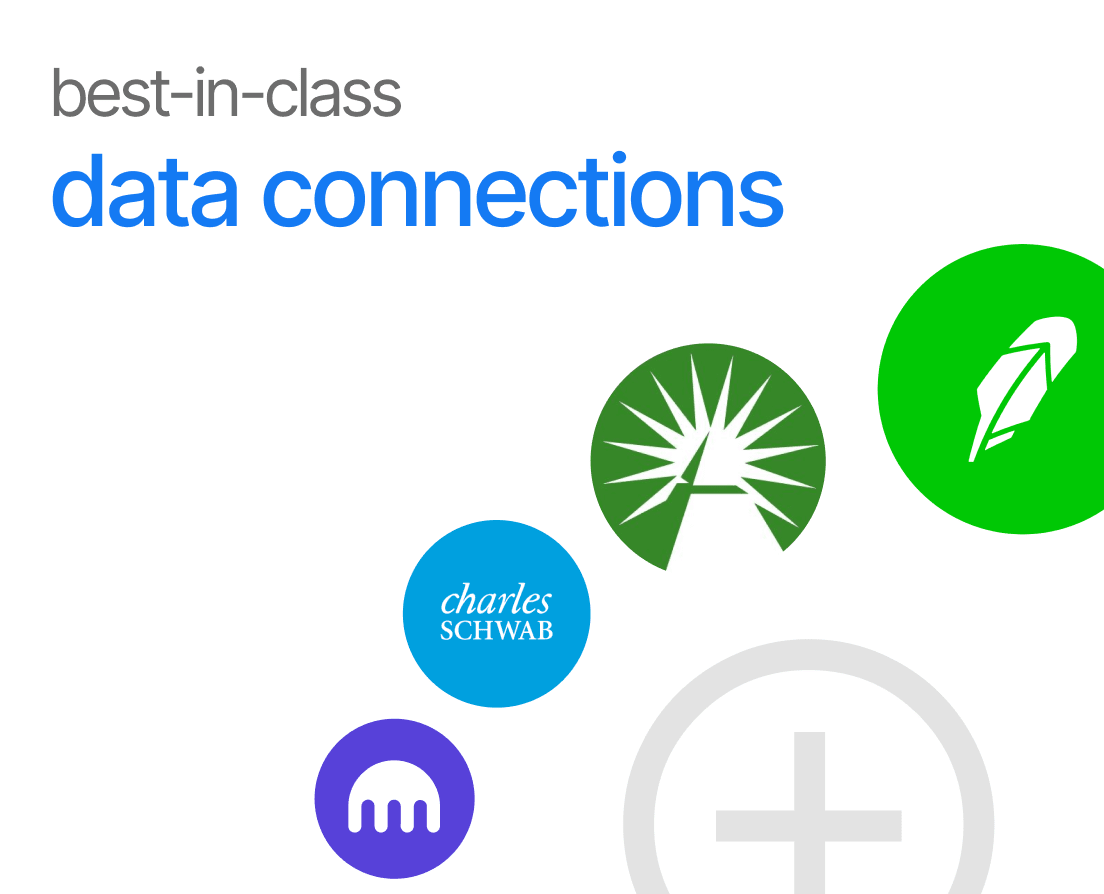
Link in a tap
Securely link all your bank, credit cards, investment and loan accounts via best-in-class data connections
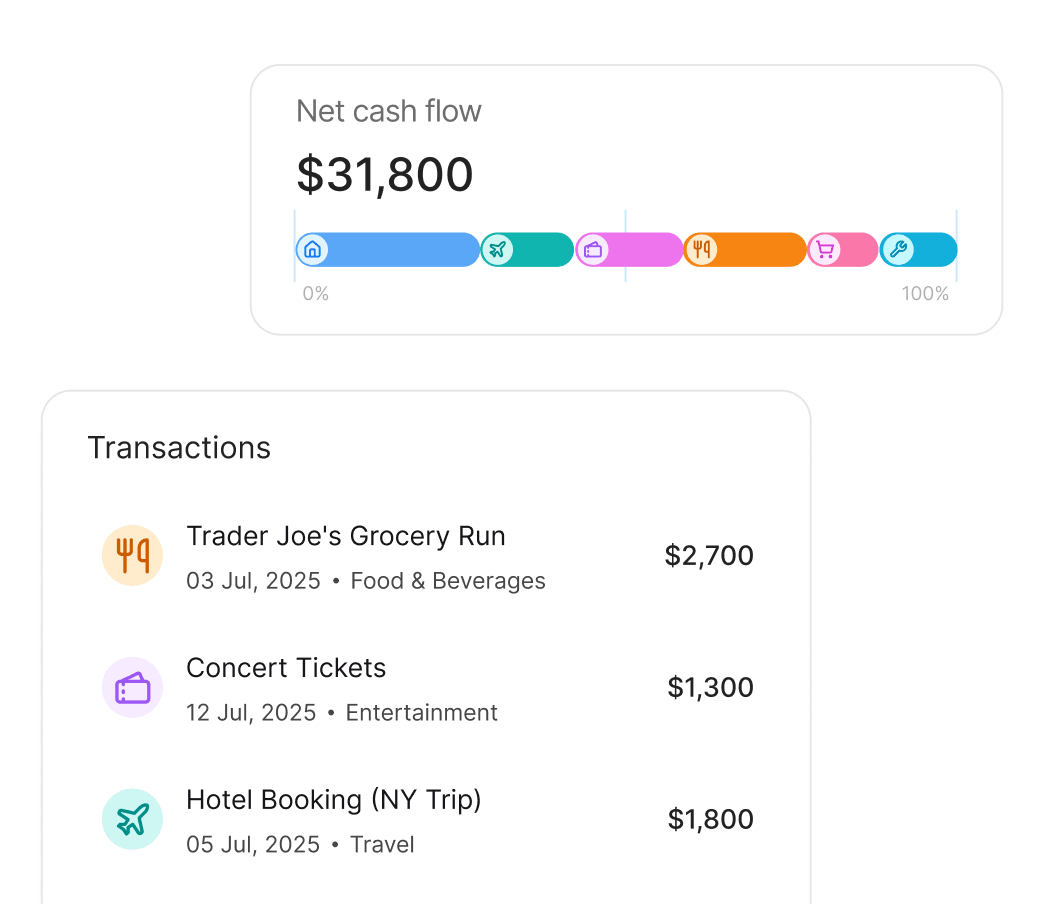
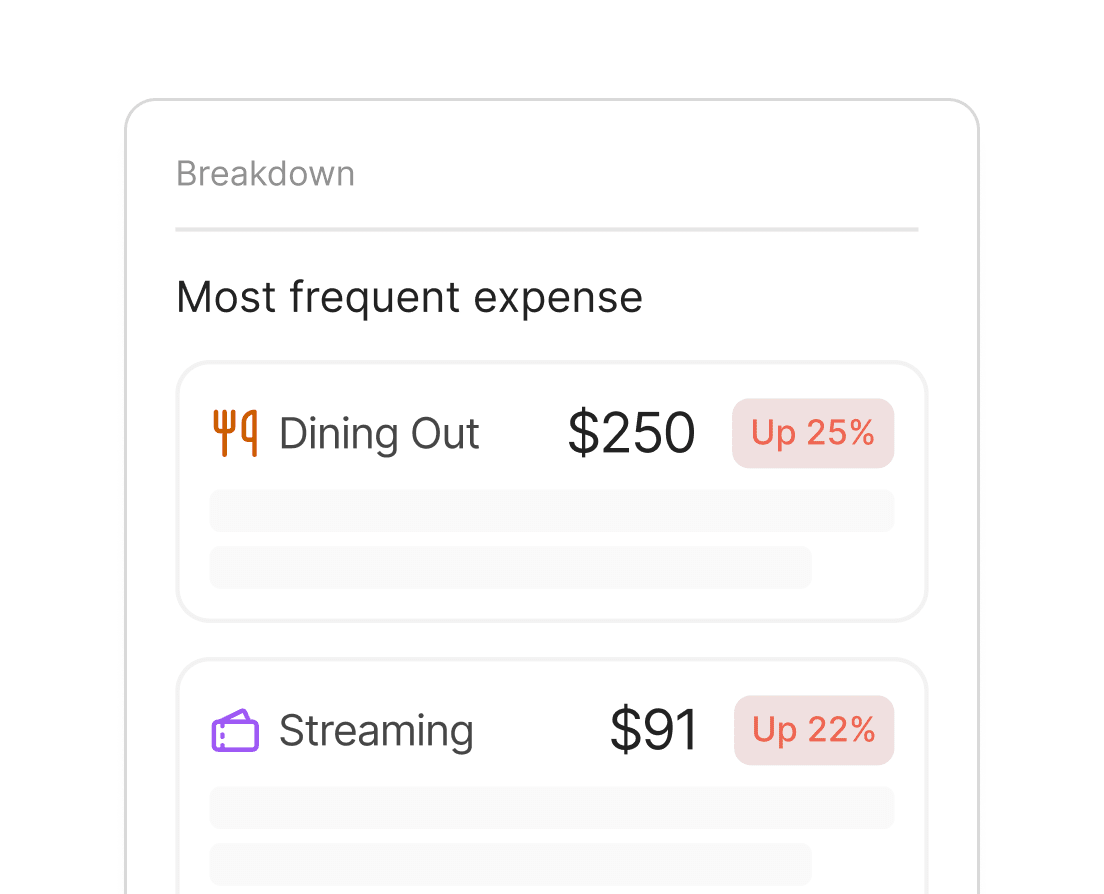
Watch the story unfold
Unified net-worth snapshot of income and expenses and a drill down into every transaction, category and merchant.
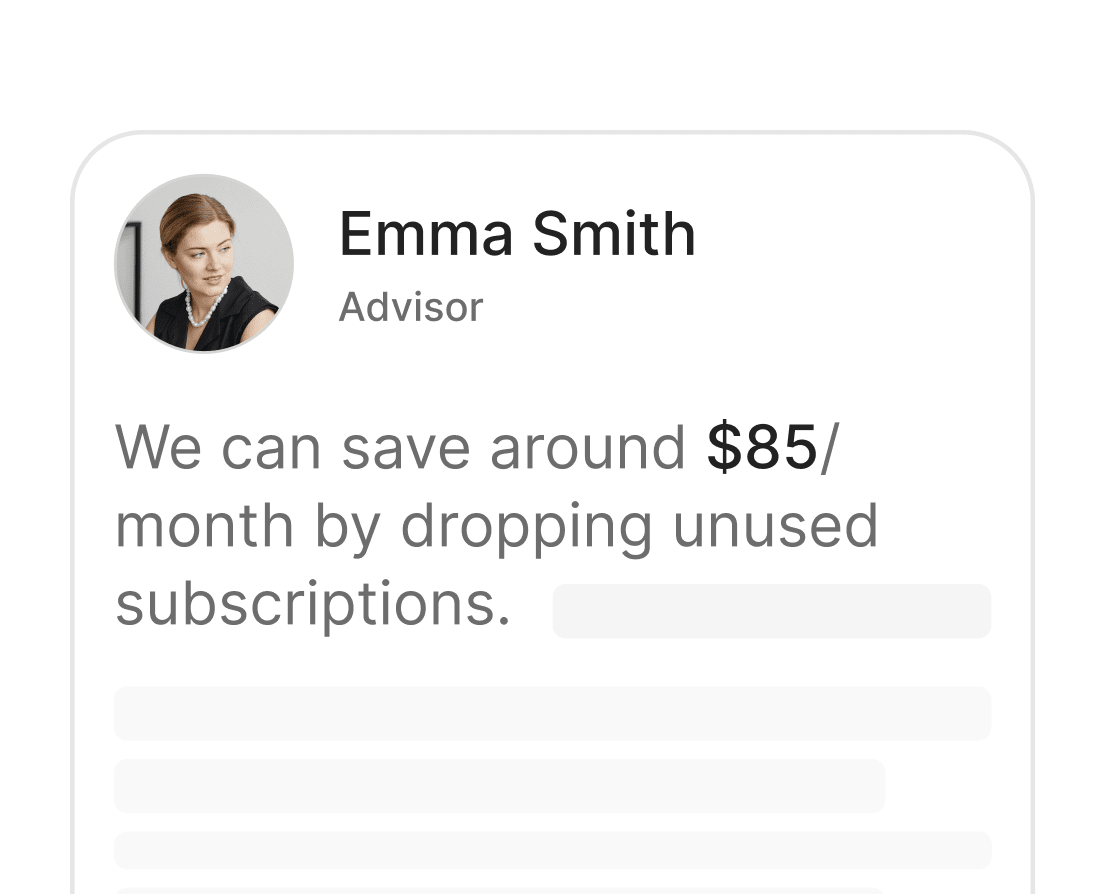
Plan and act
Your dedicated advisor flags spikes in expenses and reallocates cash towards goals
Automate and track
Get personalized budgeting insights, smart nuggets and real time data to stay on track with zero manual work.
Why you’ll love Alphanso

Humans plus tech
a real advisor catches what algorithms miss and speeds you toward goals.

Plan as a family
share dashboards, budgets, and goals with your partner or family - everyone stays on the same page.
.webp)
What’s inside
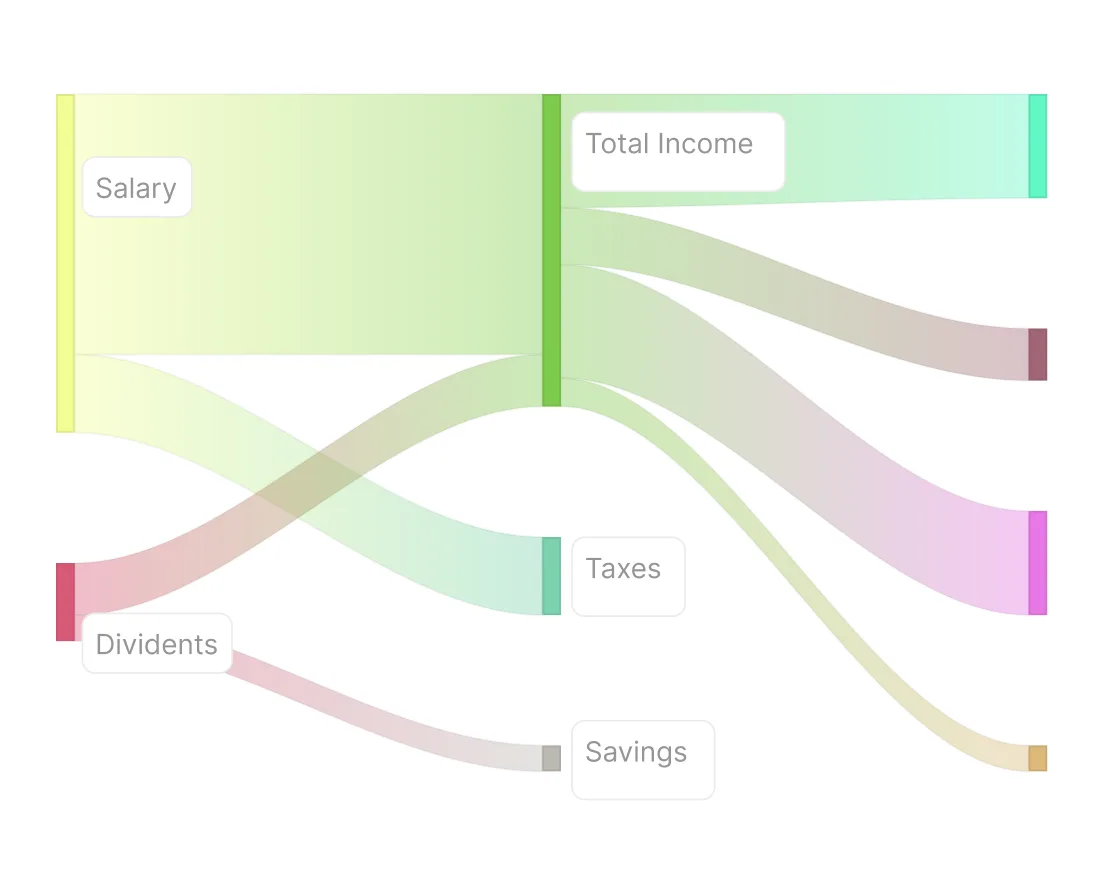
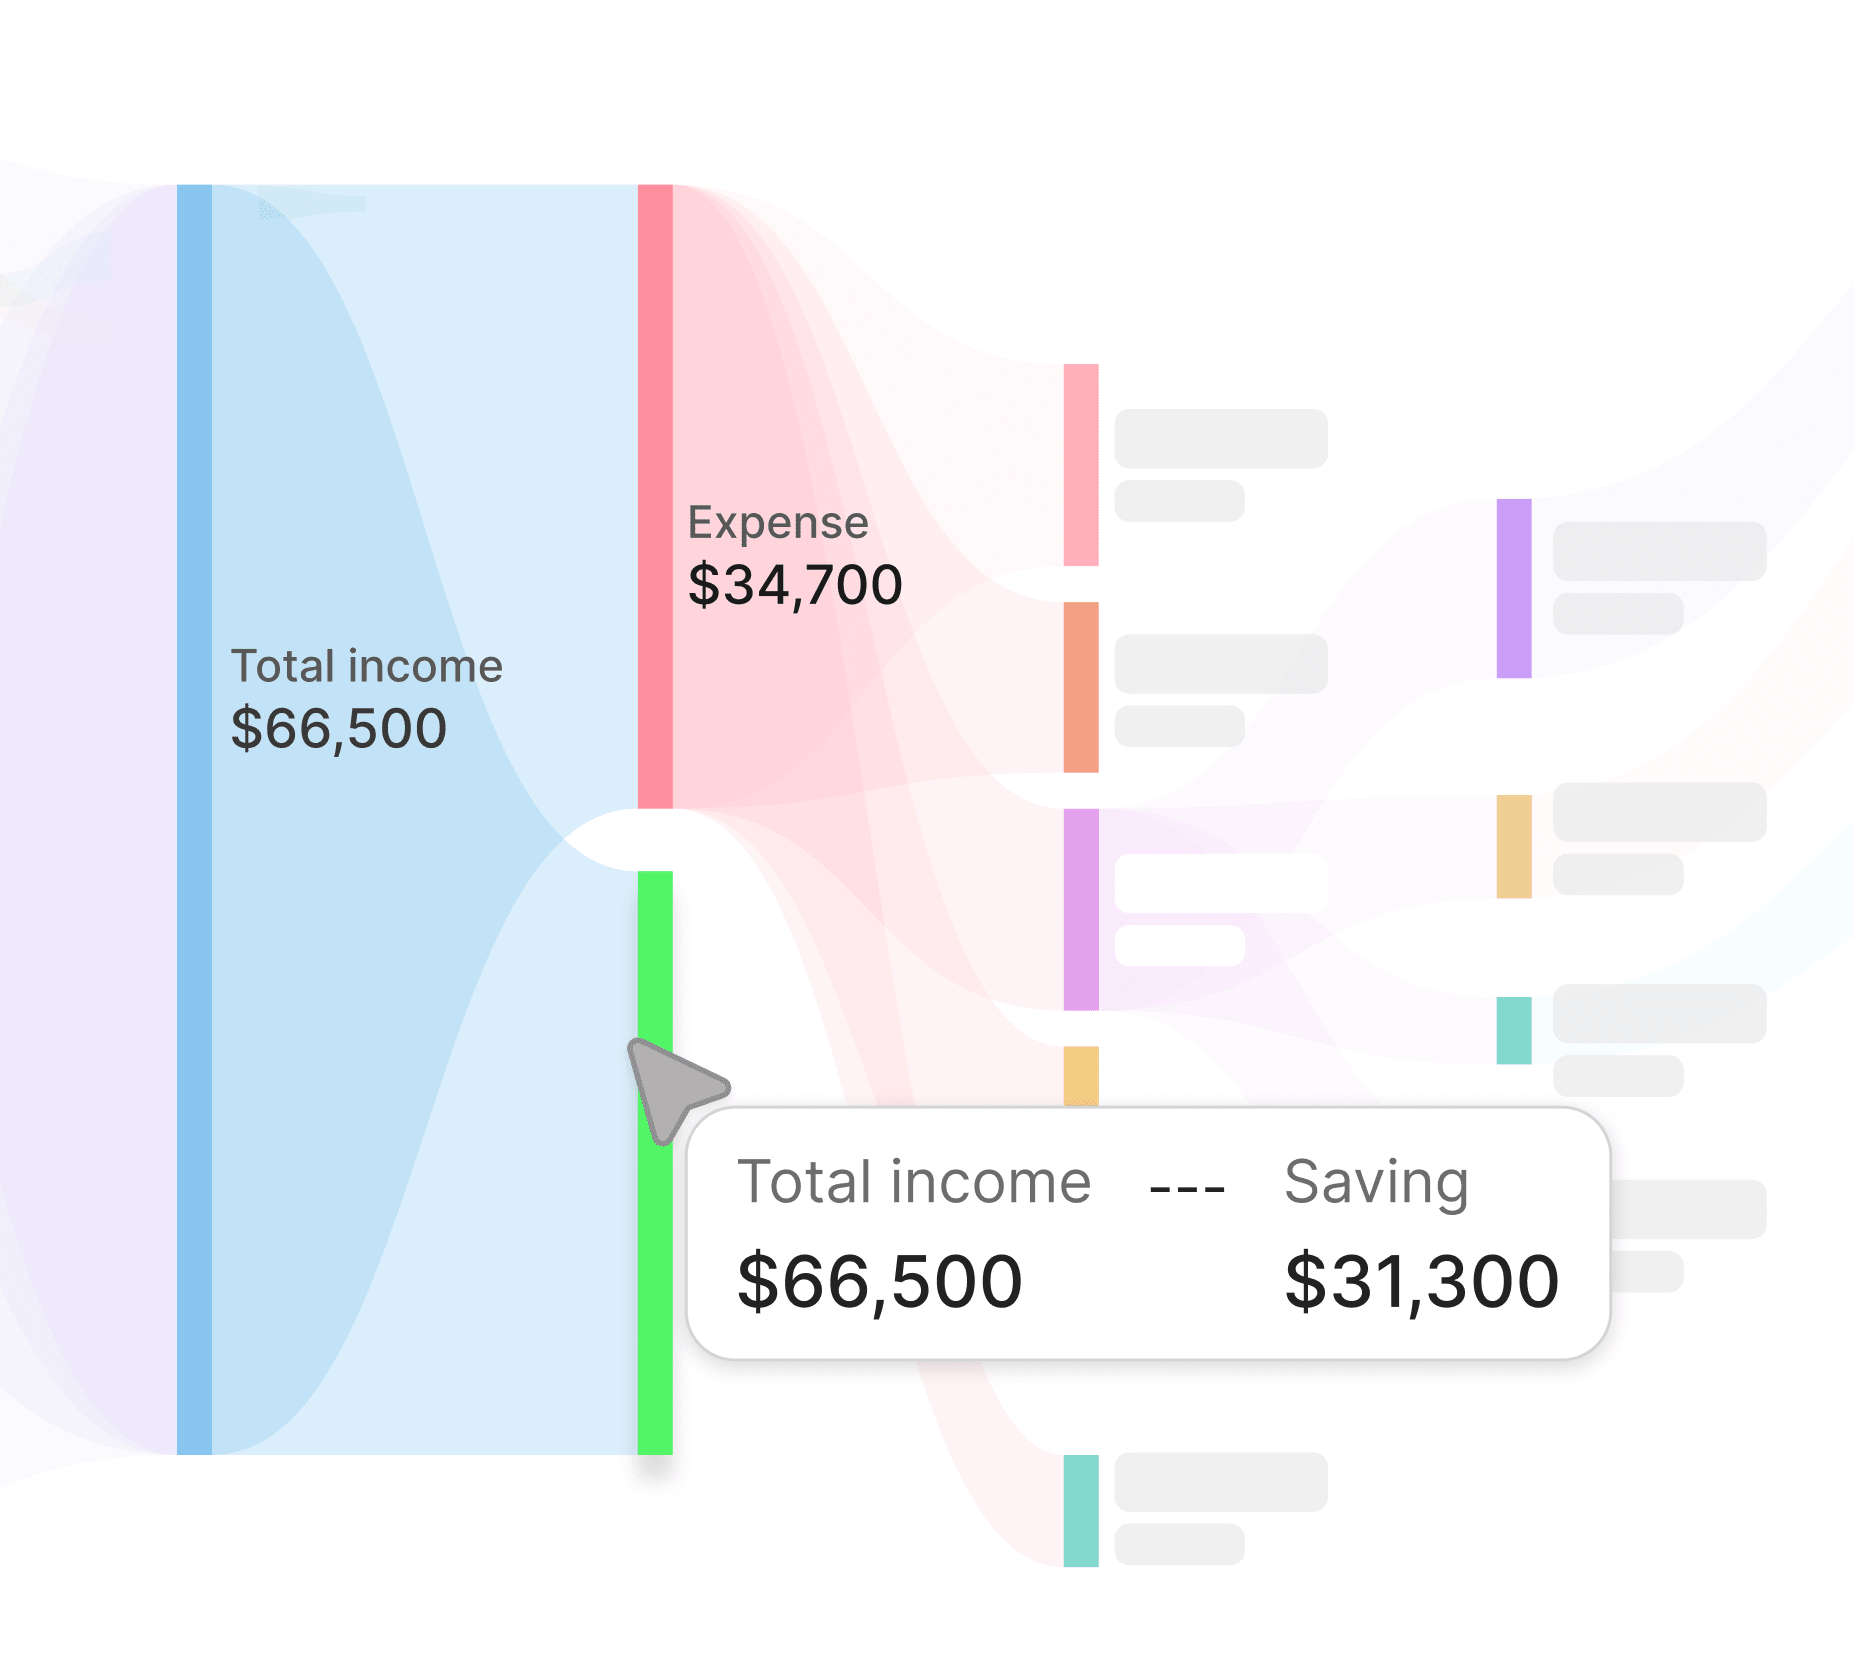
Visuals that click
Gorgeous Sankey, snapshots, and drill‑downs turn data into decisions.
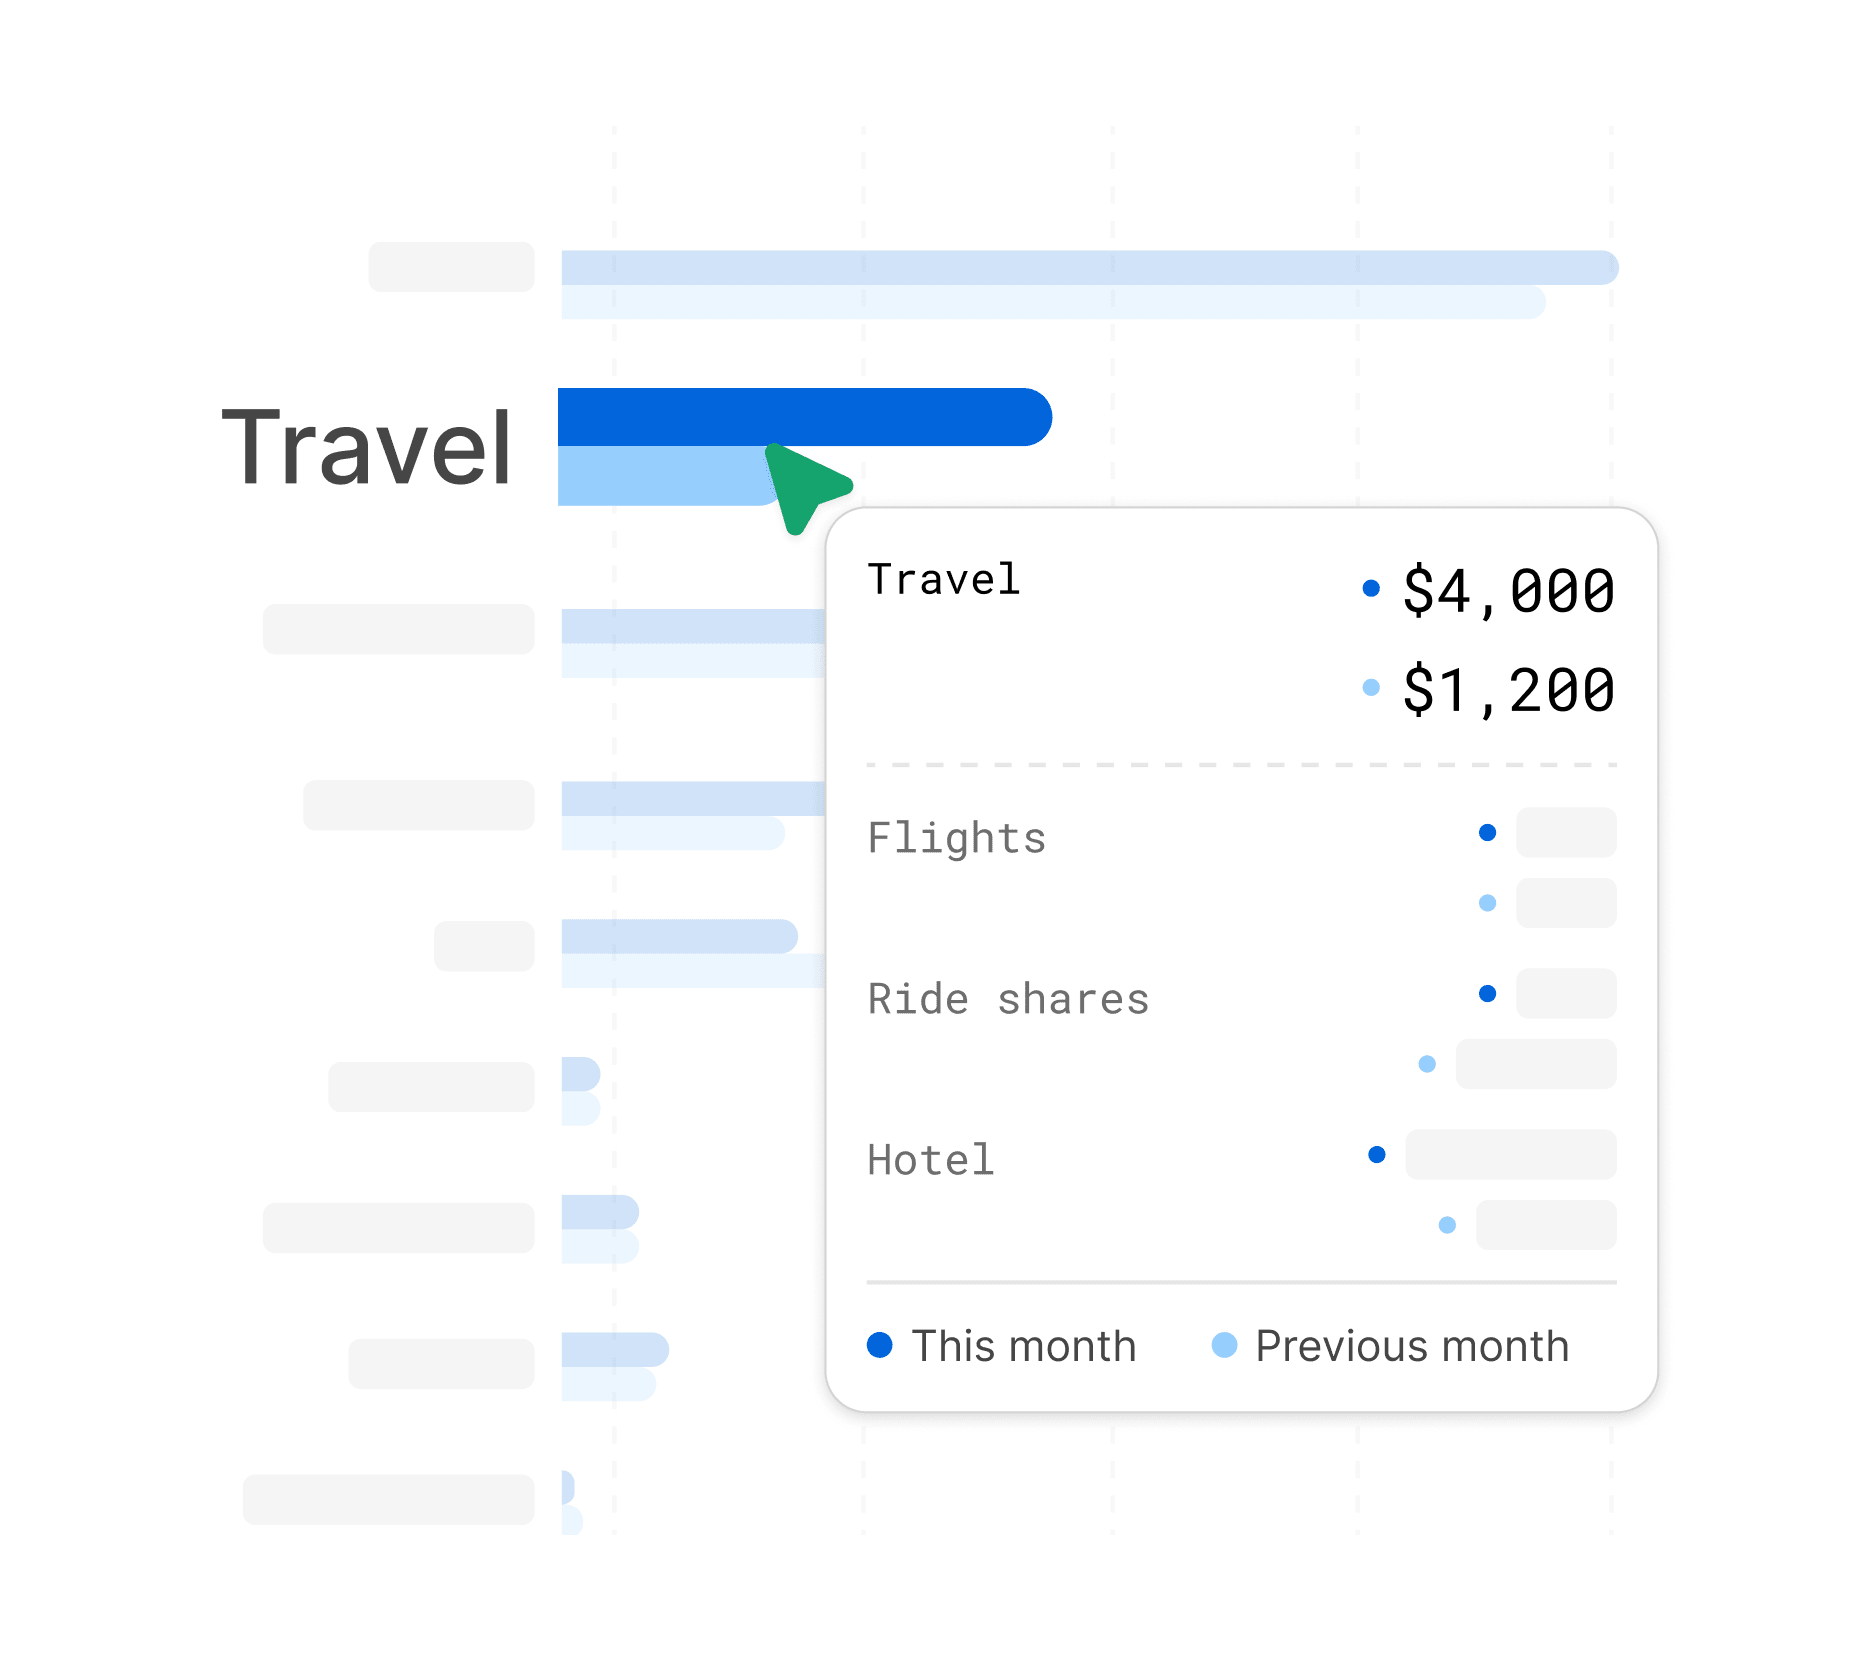
Income and expense categories
Confidently navigate your money and compare change daily, weekly, monthly.
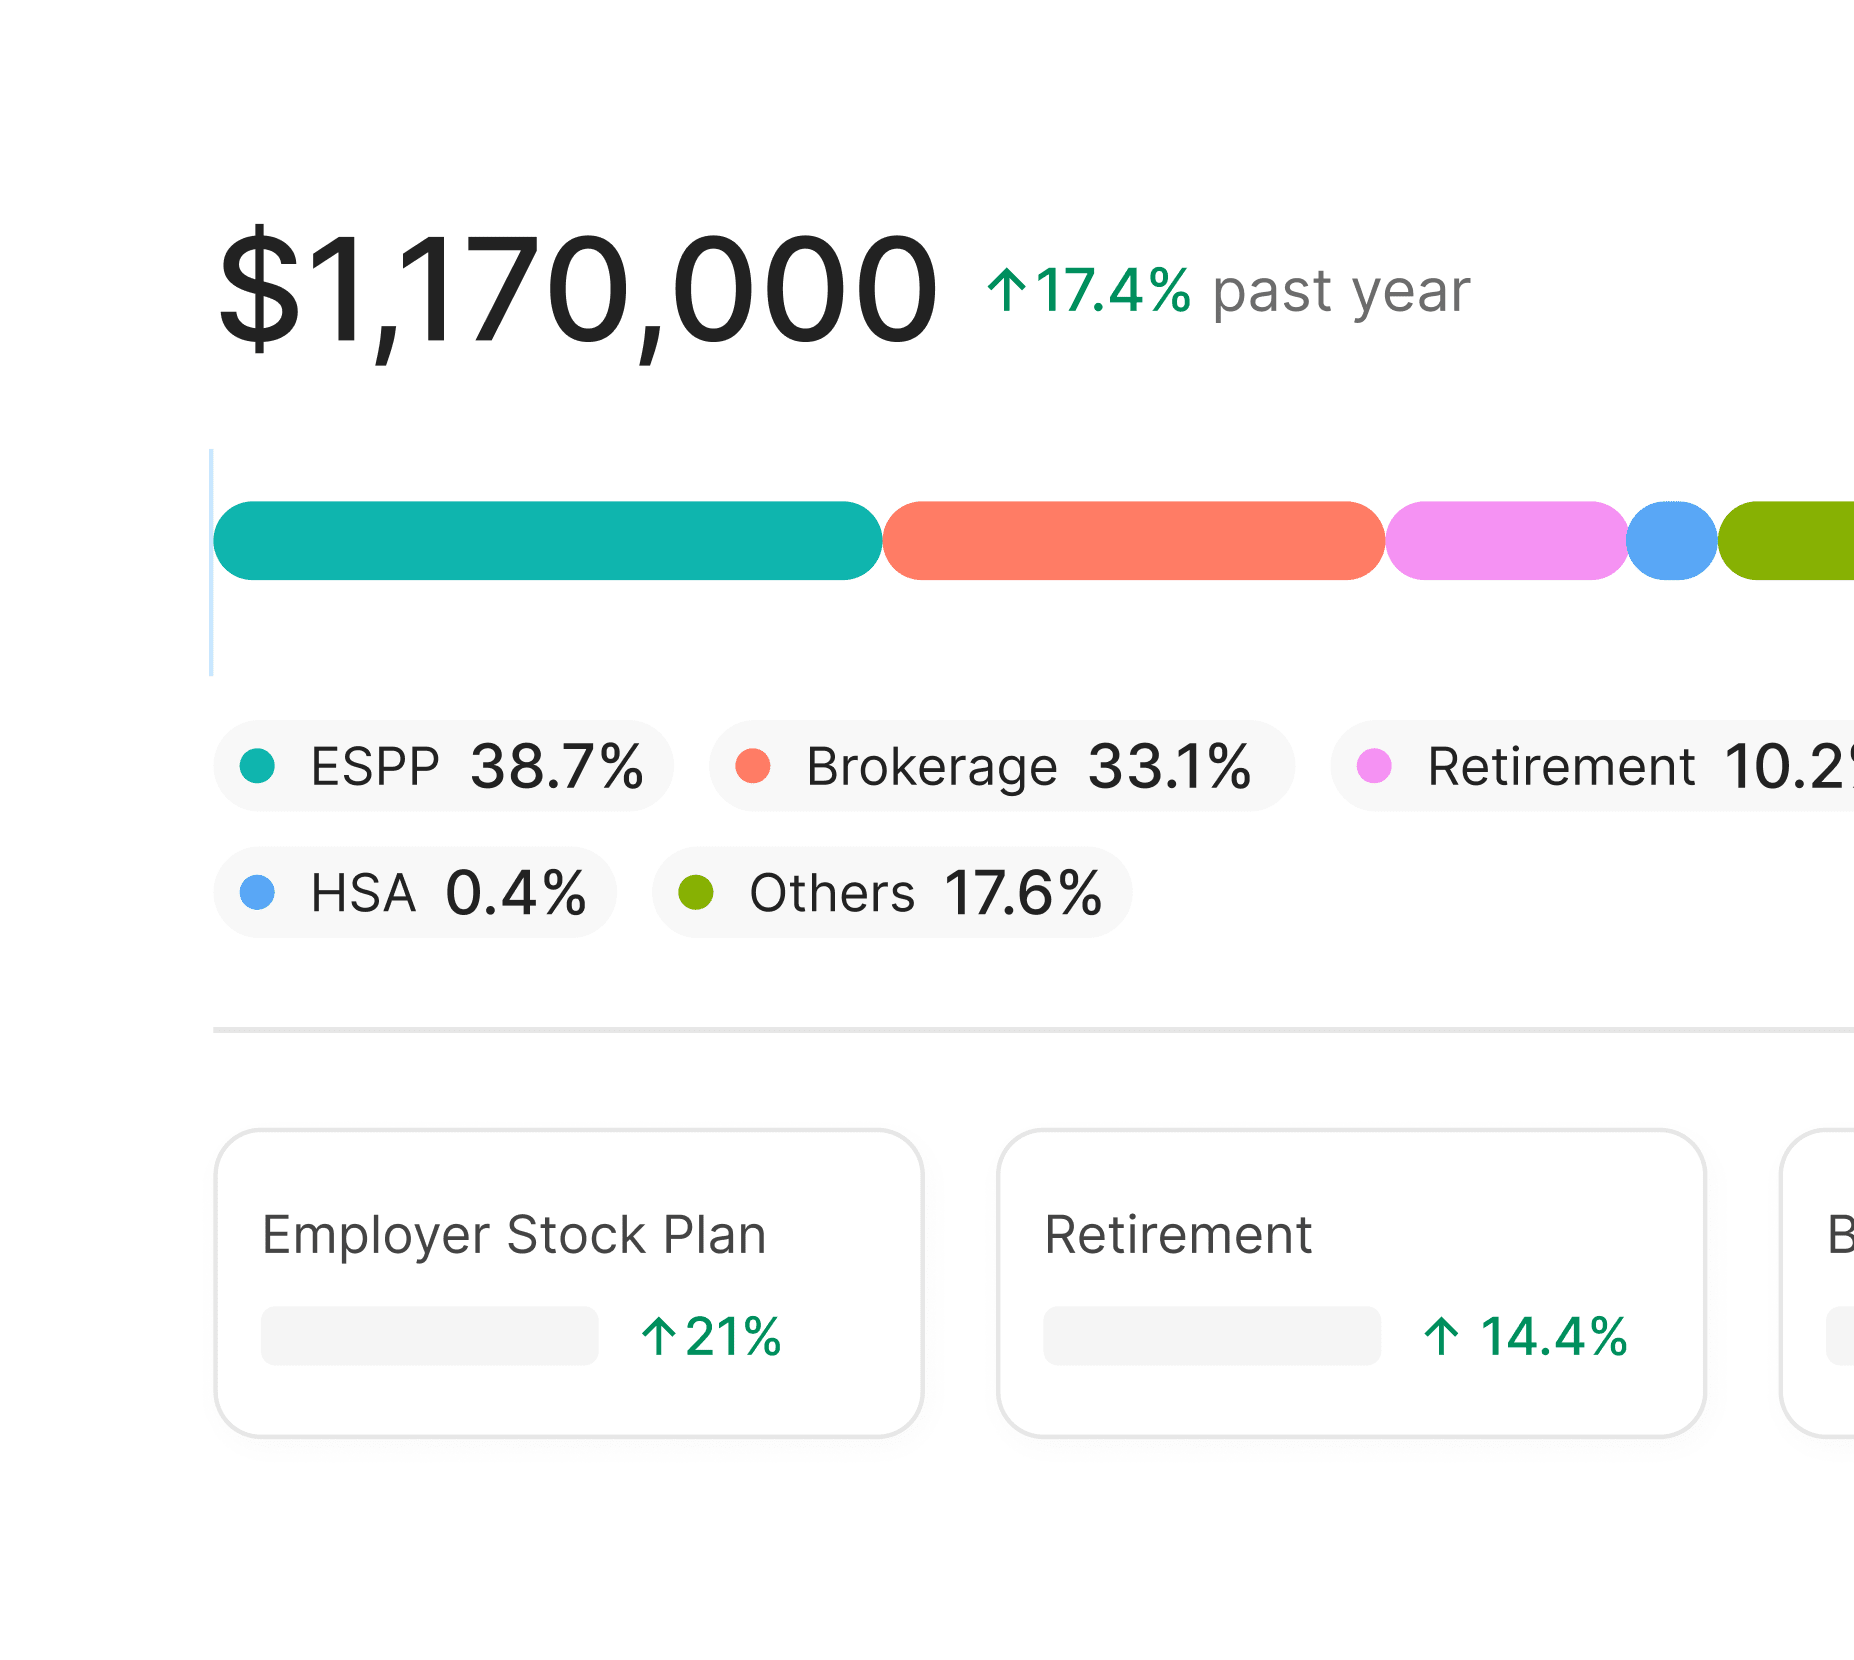
Net worth in real time
Stocks, ETFs, bonds, crypto, 401(k), RSUs, loans - all in one platform
Rock solid security
256‑bit encryption, registered advisors, read‑only data feeds.

FAQs
Is my data safe?

Yes - read‑only connections plus bank‑grade encryption.
Will my partner and I get one dashboard?
Totally up to you. Plan your finances together in one dashboard or create individual dashboards for deeper analysis.
Can my family members access my account?
We offer 2 separate accounts on Advanced plan, and 4 separate accounts on Elite plan. No account member can access (view, edit) other account data, however the parent account can remove account access for other accounts.
FAQs
Is my data safe?
Yes - read‑only connections plus bank‑grade encryption.
Will my partner and I get one dashboard?
Totally up to you. Plan your finances together in one dashboard or create individual dashboards for deeper analysis.
Can my family members access my account?
We offer 2 separate accounts on Advanced plan, and 4 separate accounts on Elite plan. No account member can access (view, edit) other account data, however the parent account can remove account access for other accounts.