The recent inflation data seems to ward off the investor nightmare. The troubles of aggressive interest rate hikes by the Federal Reserve and the possibility of a hard landing for the economy no longer appear to breathe down their neck. However, these projections appear to be a financial candyfloss, masking the recent upheaval of gas prices and retail earnings, which indicate another challenging month for the fight against inflation.
While most consumers focus on the fluctuation of interest rates by the U.S. Central Bank, their most stimulative economic tool, the balance sheet remains an enigma. This behind-the-scenes element of Fed policy has immense implications for the U.S. economy, the stock market, monetary policy, and your pocketbook.
What is Fed Balance Sheet? How is it used?
Like any other balance sheet, the Federal Reserve exhibits its assets and liabilities. The assets chiefly consist of U.S. Treasury notes, bonds, and agency mortgage-backed securities. And its liabilities are primarily the U.S. currency in circulation, bank reserves held in Fed accounts, and reverse repurchase agreements collateralized by Treasury securities.
When the Federal Reserve buys debt instruments such as Treasury notes or mortgage-backed securities, it strives to supplement their price and lower yields while prompting a laxer monetary policy to support the economy, known as the up-cycle. Conversely, the sale of Fed assets is a policy-tightening approach that curbs the asset values and dampens the financial set-up, known as the down-cycle.
Correlation between Market and Fed Balance Sheet
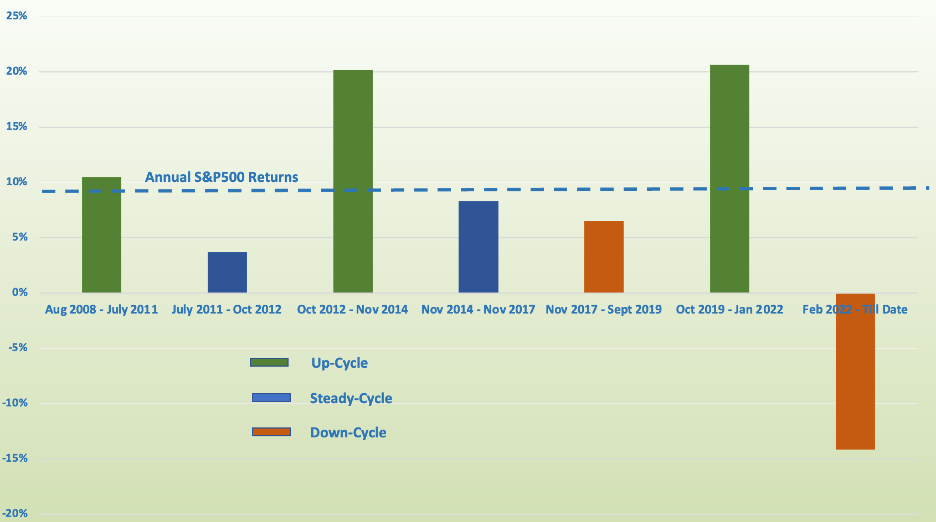
Past data suggests that markets tend to do good when the Federal Reserve expands (up-cycle) its balance sheet. The excess liquidity generated during up-cycles by the Fed transactions ensues buying pressure in riskier asset classes, including equities.
As we can see below, the S&P500 has generated above-average annual returns in up-cycles and below-average annual returns in down and steady cycles over the last 10 years.
Where are we now?
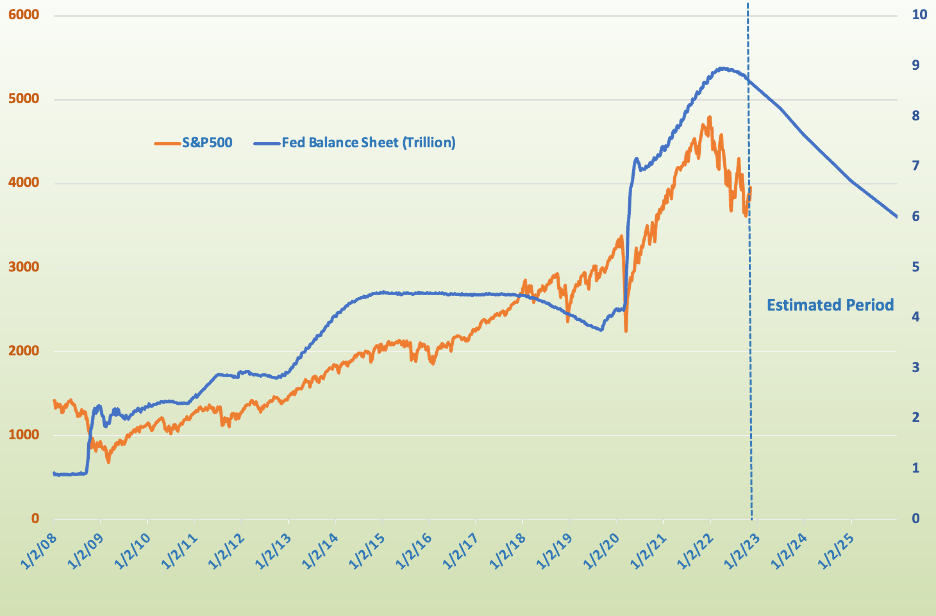
The Federal Reserve has almost $8.7 trillion in assets on its balance sheet. Historically, the steady rate of increase in the balance sheet for the Fed has been 15% annually. But due to Covid-related disruptions, the Fed expanded its assets by more than 39% annually over the last three years.
What the future holds
A May 2022 projection by the Federal Reserve Bank of New York shows the balance sheet declining to $5.9 trillion in 2025. That would imply an annual reduction in the balance sheet by almost 12%, as shown in the chart below. The Fed has never engaged in such unprecedented levels of withdrawals of liquidity.
This graph could sketch years of latent underperformance of the stock markets. Empirical evidence from historical data also suggests significant risks to equity markets. Particularly for longer-duration assets, including growth stocks, whose valuations were driven to notably high levels by the Fed’s easy monetary policy. We could be in for a significant market correction if the Fed surprises markets by rapidly reducing its balance sheet, au contraire to its announcement in case inflation continues to be tenacious at high levels.
Ultimately, we are at that phase of the economic cycle where there are more impediments than opportunities. Thus it becomes imperative to pick stocks supported by the current dynamics. Investors should consider strategic asset allocation and diversification concentrated on some sectors and remind themselves that in the end, this too shall pass.